π
<-

Afficher les données dans un tableau - python graph 90 + e

Programmation et implémentation d'algorithmes.

Afficher les données dans un tableau - python graph 90 + e

Unread postby cyberespia » 08 Dec 2021, 21:21

Il existe un moyen d'afficher des données tabulées, c'est-à-dire dans un tableau.
J'ai testé ce code, mais il le montre horizontalement

Code: Select all
## Python program to print the data
d = {1: ["Python", 33.2, 'UP'],2: ["Java", 23.54, 'DOWN'],3: ["Ruby", 17.22, 'UP'],10: ["Lua", 10.55, 'DOWN'],5: ["Groovy", 9.22, 'DOWN'],6: ["C", 1.55, 'UP'] }
print ("{:<8} {:<15} {:<10} {:<10}".format('Pos','Lang','Percent','Change'))
for k, v in d.items():
  lang, perc, change = v
print ("{:<8} {:<15} {:<10} {:<10}".format(k, lang, perc, change))


Il existe un autre moyen ou bibliothèque d'utiliser et d'afficher des données dans des tableaux. si possible avec scroll
User avatar
cyberespia
Niveau 2: MI2 (Membre Initié)
Level up: 80%
 
Posts: 5
Joined: 15 Oct 2021, 18:35
Gender: Not specified
Calculator(s):
MyCalcs profile

Re: Afficher les données dans un tableau - python graph 90 +

Unread postby critor » 08 Dec 2021, 21:28

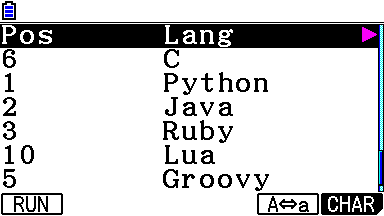
À un tout petit problème d'indentation près, ton code marche très bien et tu peux bien scroller une fois terminé :
Code: Select all
## Python program to print the data
d = {1: ["Python", 33.2, 'UP'],2: ["Java", 23.54, 'DOWN'],3: ["Ruby", 17.22, 'UP'],10: ["Lua", 10.55, 'DOWN'],5: ["Groovy", 9.22, 'DOWN'],6: ["C", 1.55, 'UP'] }
print ("{:<8} {:<15} {:<10} {:<10}".format('Pos','Lang','Percent','Change'))
for k, v in d.items():
  lang, perc, change = v
  print ("{:<8} {:<15} {:<10} {:<10}".format(k, lang, perc, change))

Image
Image
User avatar
critorAdmin
Niveau 19: CU (Créateur Universel)
Level up: 47.5%
 
Posts: 41976
Images: 15730
Joined: 25 Oct 2008, 00:00
Location: Montpellier
Gender: Male
Calculator(s):
MyCalcs profile
YouTube: critor3000
Twitter: critor2000
GitHub: critor

Re: Afficher les données dans un tableau - python graph 90 +

Unread postby cyberespia » 08 Dec 2021, 21:34

Excellent merci. :yo:
User avatar
cyberespia
Niveau 2: MI2 (Membre Initié)
Level up: 80%
 
Posts: 5
Joined: 15 Oct 2021, 18:35
Gender: Not specified
Calculator(s):
MyCalcs profile


Return to Programmation

Who is online

Users browsing this forum: ClaudeBot [spider] and 3 guests

-
Search
-
Social TI-Planet
-
Featured topics
Comparaisons des meilleurs prix pour acheter sa calculatrice !
"1 calculatrice pour tous", le programme solidaire de Texas Instruments. Reçois gratuitement et sans aucune obligation d'achat, 5 calculatrices couleur programmables en Python à donner aux élèves les plus nécessiteux de ton lycée. Tu peux recevoir au choix 5 TI-82 Advanced Edition Python ou bien 5 TI-83 Premium CE Edition Python.
Enseignant(e), reçois gratuitement 1 exemplaire de test de la TI-82 Advanced Edition Python. À demander d'ici le 31 décembre 2024.
Aidez la communauté à documenter les révisions matérielles en listant vos calculatrices graphiques !
1234
-
Donations / Premium
For more contests, prizes, reviews, helping us pay the server and domains...
Donate
Discover the the advantages of a donor account !
JoinRejoignez the donors and/or premium!les donateurs et/ou premium !


Partner and ad
Notre partenaire Jarrety Calculatrices à acheter chez Calcuso
-
Stats.
703 utilisateurs:
>655 invités
>40 membres
>8 robots
Record simultané (sur 6 mois):
6892 utilisateurs (le 07/06/2017)
-
Other interesting websites
Texas Instruments Education
Global | France
 (English / Français)
Banque de programmes TI
ticalc.org
 (English)
La communauté TI-82
tout82.free.fr
 (Français)